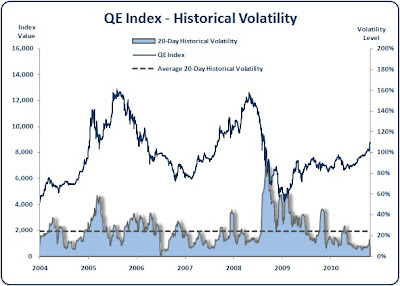
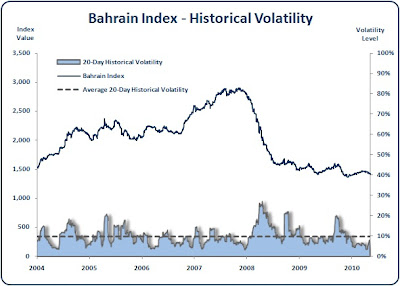
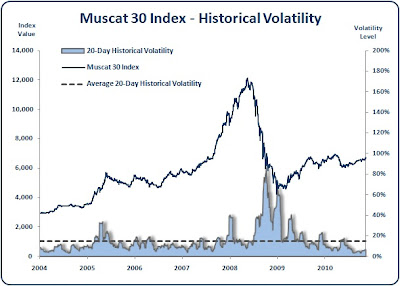
The charts below show the price performance of each GCC market index along with the corresponding 20-day volatility (blue shaded area) and the average 20-day volatility (dashed lined).
For those not familiar with volatility check out Google or see this: Volatility
As you can see, for all GCC equity markets the current 20-day volatility is well below the historical averages. In fact, for several markets the current volatility levels as low as they've been for some time.
Which begs the question: are we due for an increase in volatility in 2011? And if volatility does increase will it be accompanied by an upward or downwards move in stock markets?
In upcoming posts I'll be taking a closer look at volatility of GCC equity markets and whether it can tell us anything revealing about future price action.


No comments:
Post a Comment